Science cluster

Summary
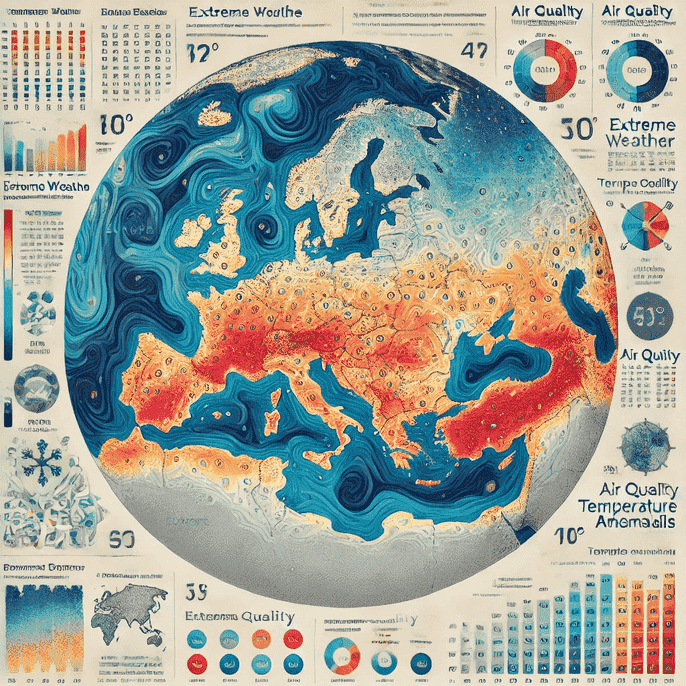
Human-made climate change is one of the main challenges that current societies are facing. As the impacts become increasingly relevant, near-real-time monitoring of the climate, namely the evolution of variables such as rainfall and temperature, is something essential. The Regional State of the Climate dashboard - RSOTC project aims to create a web-based dashboard providing near-real-time climate data (maps and diagrams) for European political regions (e.g., NUTS divisions), showing the evolution of climate indicators as those used in the “State of the climate” (SofC) reports. It will enable users to visualise climate trends such as rainfall and temperature, applying FAIR principles to ensure open access, reproducibility, and transparency. The project leverages existing climate data, integrates advanced statistical tools, and enhances access for scientific analysis, policy-making, and public awareness.
Challenge
Open Science project, Open Science Service
While State of the Climate (SofC) reports (e.g., WMO, C3S, AEMET, NOAA, CSIRO) have been gathering increased public attention, they often lack regional detail (such as time series and histograms) and do not typically follow FAIR principles: although data are usually open, the code and algorithms used for downloading and processing it are not, thus hindering reproducibility. Additionally, current reports tend to omit statistical insights, such as trend analysis or advanced filtering, which limits the understanding of long-term climate patterns vs. short-term variability.
Solution
The RSOTC project will provide a FAIR-by-design service that offers visual and statistical insights into climate trends at regional levels. In this respect, the RSOTC dashboard will allow users to explore regional climate data with unprecedented detail. All the assets used to build the whole workflow, from downloading the data to producing the figures, will undergo the FAIR principles. The dashboard integrates open-access data from ERA5 reanalysis and E-OBS gridded datasets, with open workflows published in open repositories, such as GitHub and Zenodo, for further analysis and reuse. The project also foresees the development of an API to be included in the service catalogue of ENVRI and integrated with the EOSC EU Node AAI and portal systems. This will allow project members to join the EOSC federation, and to bring data from the C3S Climate Data Store to the ENVRI ecosystem.
Scientific Impact
By providing tools for statistical testing and trend identification, the project will allow users to explore climate data with unprecedented detail, such as precipitation time series with a regional detail, and to apply statistical tools to test scientific hypotheses, a feature which is not available in other similar dashboards. This will allow identifying new trends on the extremes and other important statistics, but also other important features of the data that may have been overlooked by previous analysis. The dashboard also promotes collaborative research by allowing the scientific community to share findings and insights, thereby advancing climate science and fostering informed decision-making on environmental policy.
Results
- Scalable Climate Data Downloading System: The project team developed a flexible and scalable system to automatically download historical climate data from trusted sources (i.e., Climate Data Store). The tool supports a wide range of variables and time periods, enabling fast access to consistent datasets for further analysis. This accelerates workflows and reduces manual effort in sourcing climate information.
- Consistent and Clean Climate Data Processing: All downloaded datasets are automatically processed to ensure consistency and quality. This includes cleaning metadata, aligning naming conventions, and standardizing key variables. The result is a reliable and uniform dataset that can be used directly in scientific analyses or climate services.
- Cloud-Ready Climate Datasets: Processed datasets are optimised for use in cloud environments. They are structured in a way that supports fast access and scalability, making them ideal for interactive platforms, modeling applications, and large-scale climate analytics.
- System to aggregate climate data into regions of interest: The project team implemented automated regional aggregation, which transforms gridded climate data into region-specific time series. These outputs support decision-making by providing tailored climate information for countries, river basins, or other relevant regions.
Events
- 24 September, 2024 | EOSC - ES Tripartite Event 2024
- 7–12 September, 2025 | Ljubljana, Slovenia and Online - European Meteorological Society Annual Meeting 2025
Principal investigator

Markel is a senior scientist with a strong track record in the coordination of international research projects, including EU programmes and C3S contracts. He has a Master's in Meteorology and Climatology from Complutense University (Madrid) and a PhD in Regional Climate Modelling from Cantabria University. He is also experienced in coordinating software development projects for climate modelling and data analysis. Although he comes from a scientific background, he has developed strong technical skills, in particular in software development with Python and has contributed to open-source projects.

